3D Plot Using rgl
npoints = 101
x = seq(-3, 3, length=npoints)
y = x

mvdnorm = function(v, mu=c(0, 0), mCov=matrix(c(1, 0, 0, 1), nrow=2))
{
  n = length(mu)
  d = (2*pi*det(mCov))^(-n/2)*exp(-0.5*t(v - mu) %*% solve(mCov) %*% (v - mu))
  return(as.numeric(d))
}

mvdnorm(c(1, 1), mu0, mCov0)
[1] 0.1089505
z = matrix(nrow=npoints, ncol=npoints)

for (i in 1:npoints) {
  for (j in 1:npoints) {
    z[i, j] = mvdnorm(c(x[i], y[j]), mu=mu0, mCov=mCov0)
  }
}
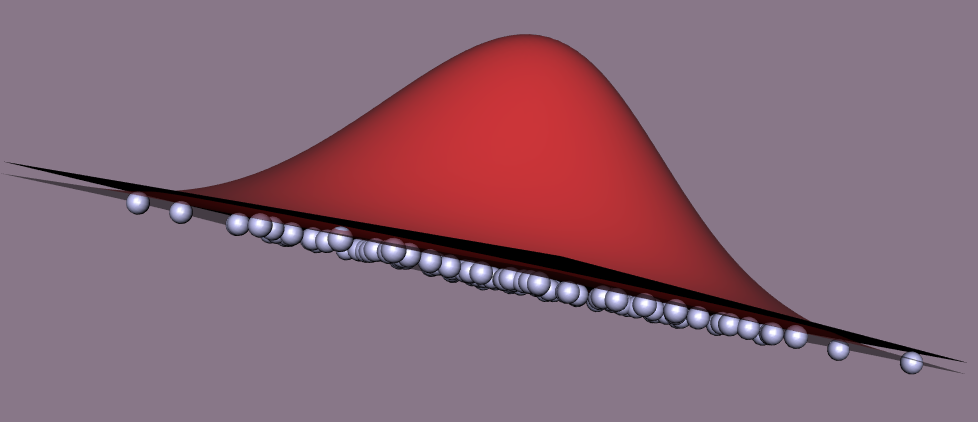
clear3d("all")
bg3d(color="#887788")
light3d()
zscale = 10
surface3d(x, y, z*zscale, color="#FF2222", alpha=0.5)

z2 = rep(NA, npoints)
for (i in 1:npoints) z2[i] = mvdnorm(r1[i,], mu=mu0, mCov=mCov0)
lines3d(r1[,1], r1[,2], z2*10)
summary(z2)
   Min. 1st Qu.  Median    Mean 3rd Qu.    Max.
0.01061 0.01061 0.01061 0.01061 0.01061 0.01061
z3 = matrix(rep(0, npoints*npoints), nrow=npoints)
spheres3d(Data[,1], Data[,2], z3, radius=0.1, color="#CCCCFF")

z4 = matrix(rep(10*median(z2), npoints*npoints), nrow=npoints)
surface3d(x, y, z4, color="#000000")
결과 capture한 그림
위의 R script를 직접 실행하면서 그림을 회전해보는 것이 좋다.

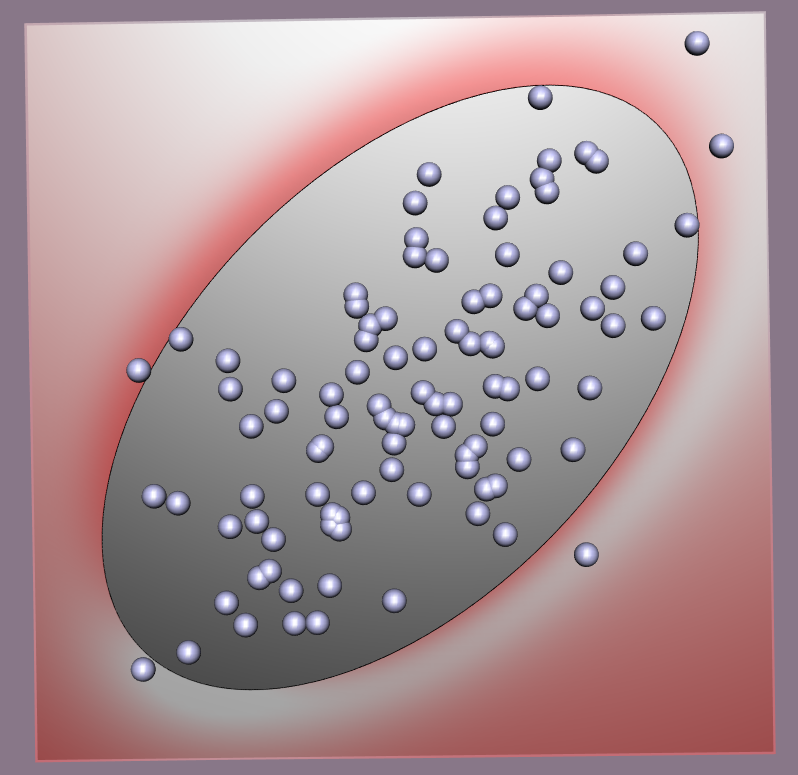
Joint confidence region과 관련해서는 car package의 ellipse, dataEllipse, confidenceEllipse 등의 함수도 있다.